We Love Dogs
Context
Most of us find it very easy to talk about how much we love and adore dogs. Many of us even have them as pets. Dogs truly are one's most loyal friend. But, even then, we have so many stereotypes towards different dog breeds. Some are aggressive, some are boring, some are too energetic, and so on.
Design Process
I had worked on a
project
related to animal adoption for my Major Studio class. This was my
primary source of inspiration to choose these data sets. I collected the
data for
reported dog bites in NYC
and
dog licenses in NYC
from NYC Open Data.
I wanted to observe if there was any correlation between which dogs are
preferred as pets and which dogs have the most reported dog bites. Here,
the reported dog bites were used as a measure for the perceived
personality of the particular dog breed.
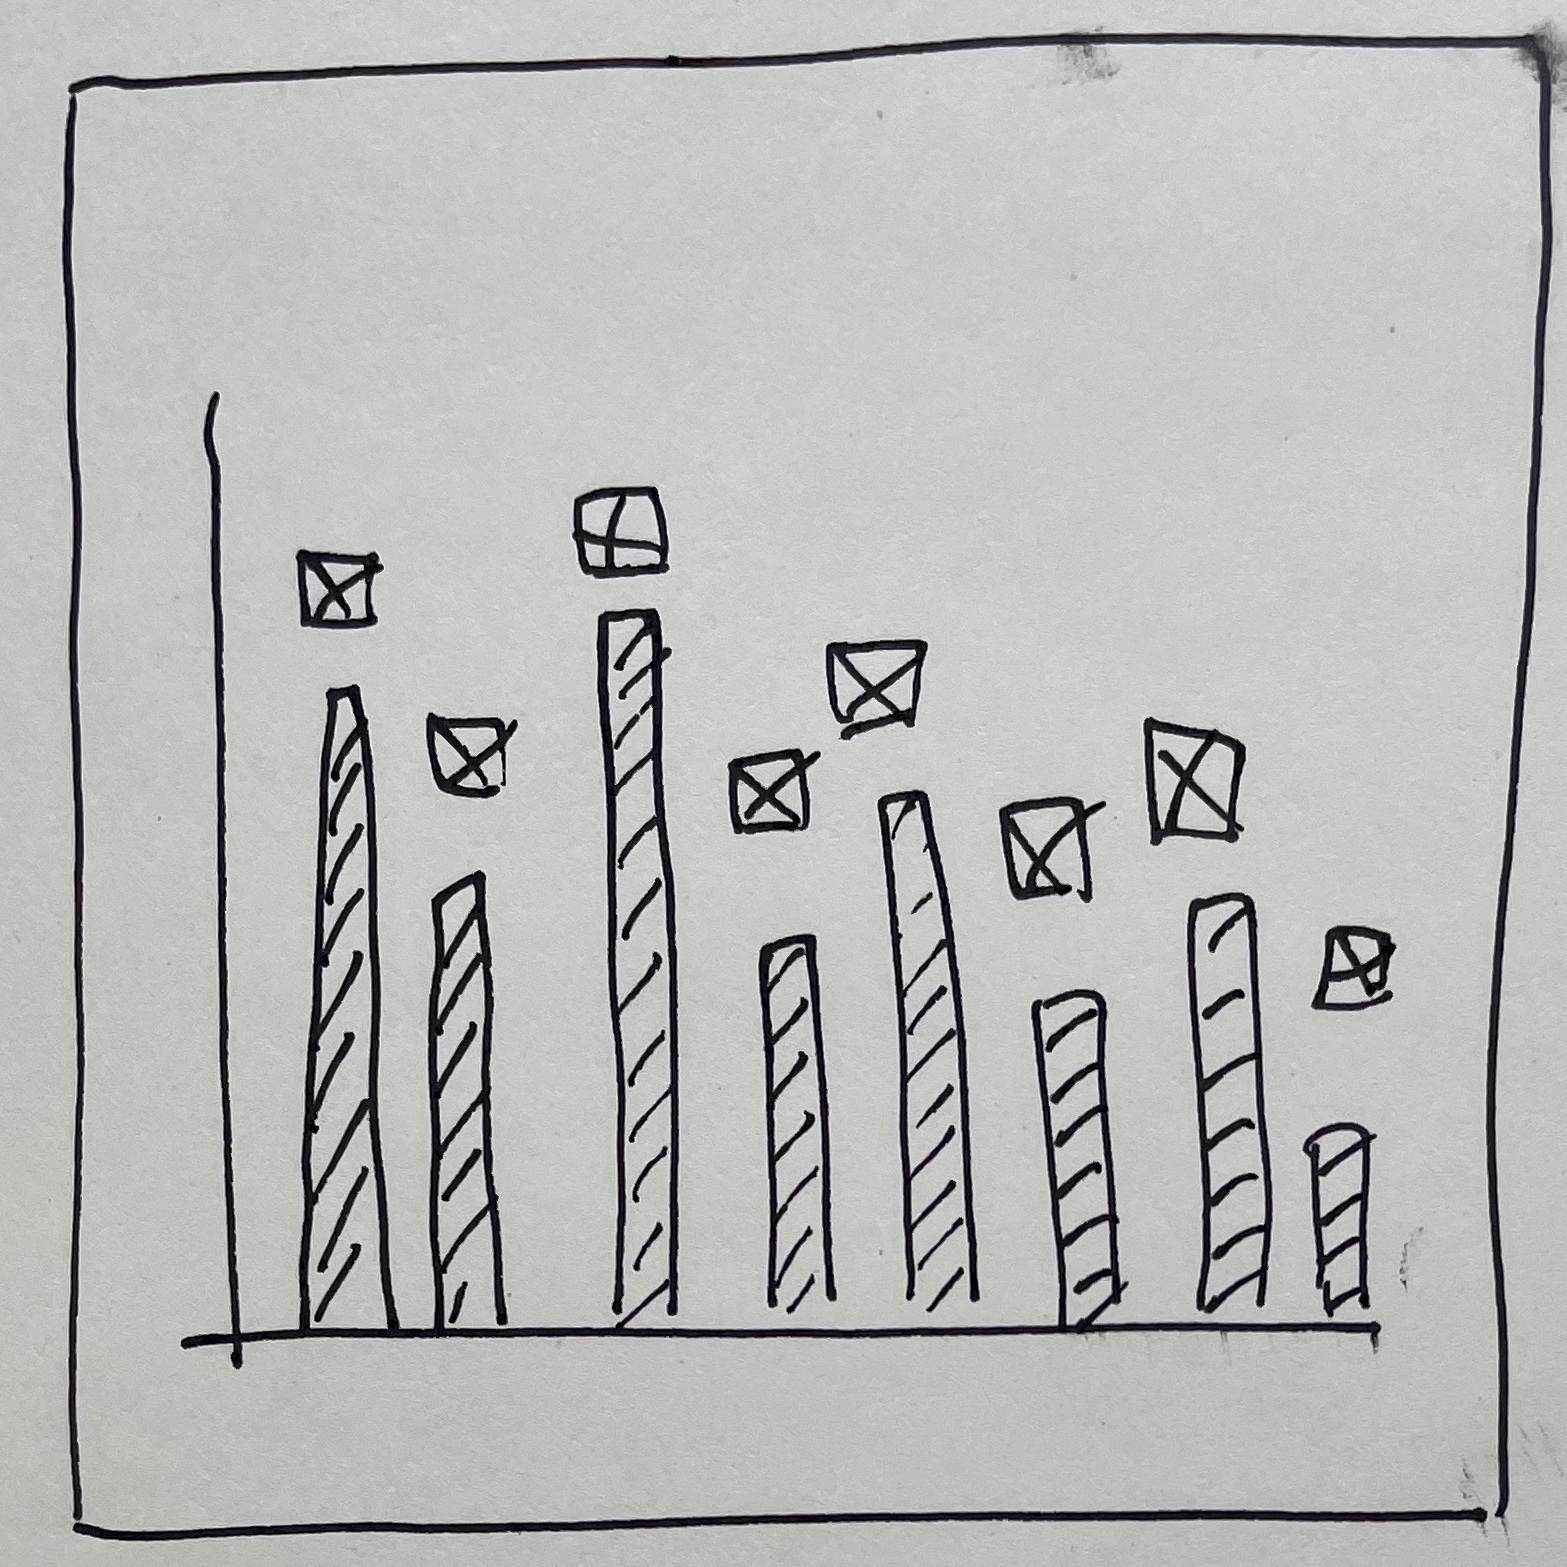
I considered different forms of visualisations where I would show all
dog breeds possible. But I wanted to focus on some of the stark
differences. Hence, I chose the top 5 breeds in both data sets. I also
avoided including the unknown data for a better depiction.


Final Tool
Reflections
During my research for Major Studio, I learnt that Pitbulls are the most
stereotyped breed amongst dog breeds. They are considered aggressive and
harmful and in some parts of the USA it is illegal to have them as pets.
When I saw that the most reported dog bites were those of
pitbulls, it made me wonder if they are reported because they are
pitbulls or if they really are as aggressive as people claim to be. In
this data there was no way to verify the circumstances in which these
incidents occurred.
As opposed to this, Yorkshire Terriers
had the least reported dog bites and most number of licenses, which
means more people prefer them as pets. This could also be because they
are smaller and in a city like New York, where apartments are small, it
is the more convenient option.
The part of the assignment which involved finding the data and deciding
how to use it was the toughest. I tried to look for many different types
of data before I found this one. Once I figured out how to represent the
data for one breed, it was very easy to replicate the same for others. I
also faced difficulty in accessing the whole data from the JSON file.
Initially, it would only calculate upto the first 1000 data points. Once
I was able to solve that issue and create a basic structure of the p5.js
sketch was clear, it was a very smooth process. I also used cute images
of dogs as a way of showing their docile side and remind people that
they don't mean any harm.
Credits
The data was collected from NYC Open Data. The images for the dogs were by Andrew Sterling, Lucia Macedo, Alicia Gauthier, Kanashi and Daria Turchak on Unsplash.