Step Map
Data Collection
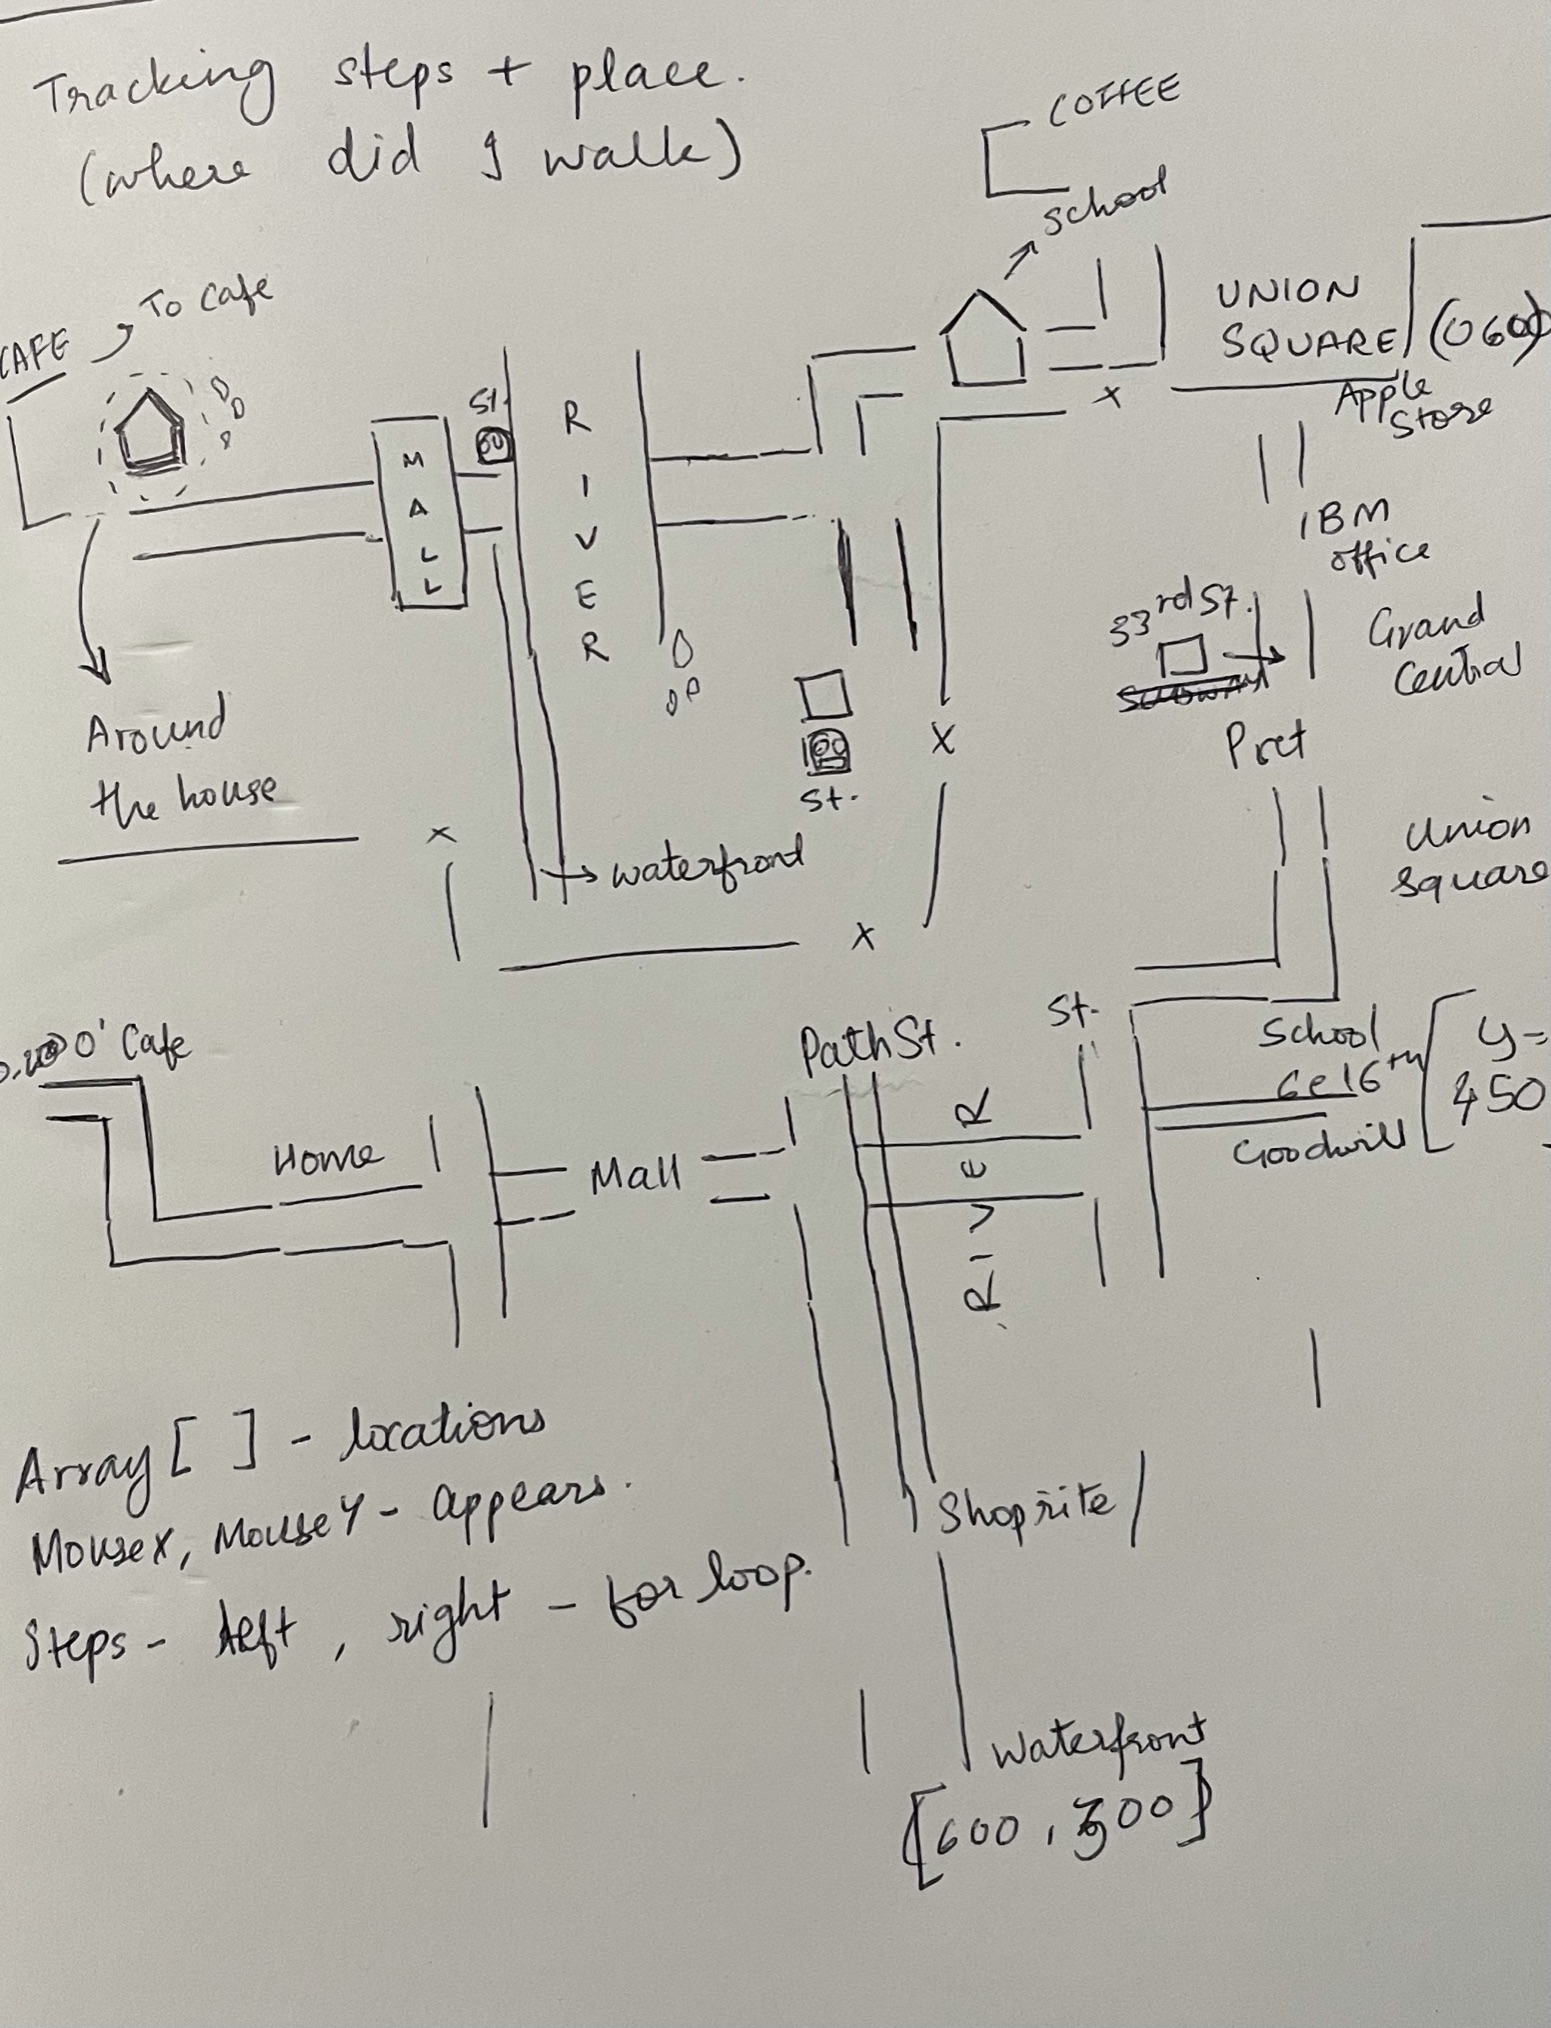
It was rather difficult to decide what data to collect from my everyday life. I realised that the one thing which changed primarily after moving to New York was that I had started walking a lot more than before. I basically walked everywhere I went (except for long distances of course!) Hence, I decided to keep track of all the places I walked to during the week and how many steps I took during that.
Design Process
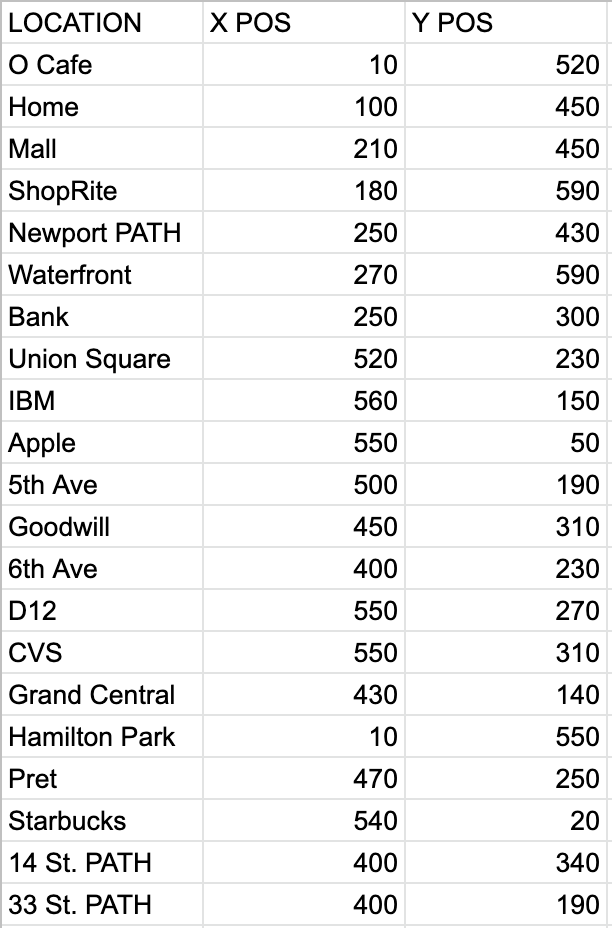
The next challenge was the representation of this data. I struggled to come up with a concept here. I was inspired by the Marauder's Map from Harry Potter to represent my steps this way. I drew out a simple map (not to scale) and then replicated it on p5.js. I also noted down the x and y positions of where these places would be on the map to make it easier to code.
Final Map
I made the map such that foot prints appear as you move the mouse around. Different places also pop up as you hover over them. I also added a mouseIsPressed function to be able to see all the places on the map at once. The link to the code is here.
Reflections
I realised through this that although it seems like I walk a lot everyday, I could definitely use some more walking everyday. It was difficult to figure out how to make the steps appear based on the mouse. It occurred to much later in the coding process to make arrays for x and y positions too. But after figuring it out, it was easy to make changes if I needed. It was also difficult to understand how noise works and implement it to get the effect of the lines. Because of the heavy code, there is a lag in the output which I wasn't exactly sure how to fix. I would have liked to also display steps between any two points on the map, which I think was lost in the visualisation process.
Credits
I downloaded a free svg for the footprint from here. I used p5.js references and examples to get the noise and CC tutorials for arrays.